Engagement rate by views or followers, and what's good
By HamzaPublished
In short
Engagement rate by views is a post's likes, comments, shares and saves divided by its views, times 100, so it shows how one post landed with the people who saw it. "Good" depends on the base: by followers, brands' all-industry medians run from 0.03% on X to 2.01% on TikTok, and by reach from about 2.5% on X to about 6% on LinkedIn.
Engagement rate by views, by reach and by followers
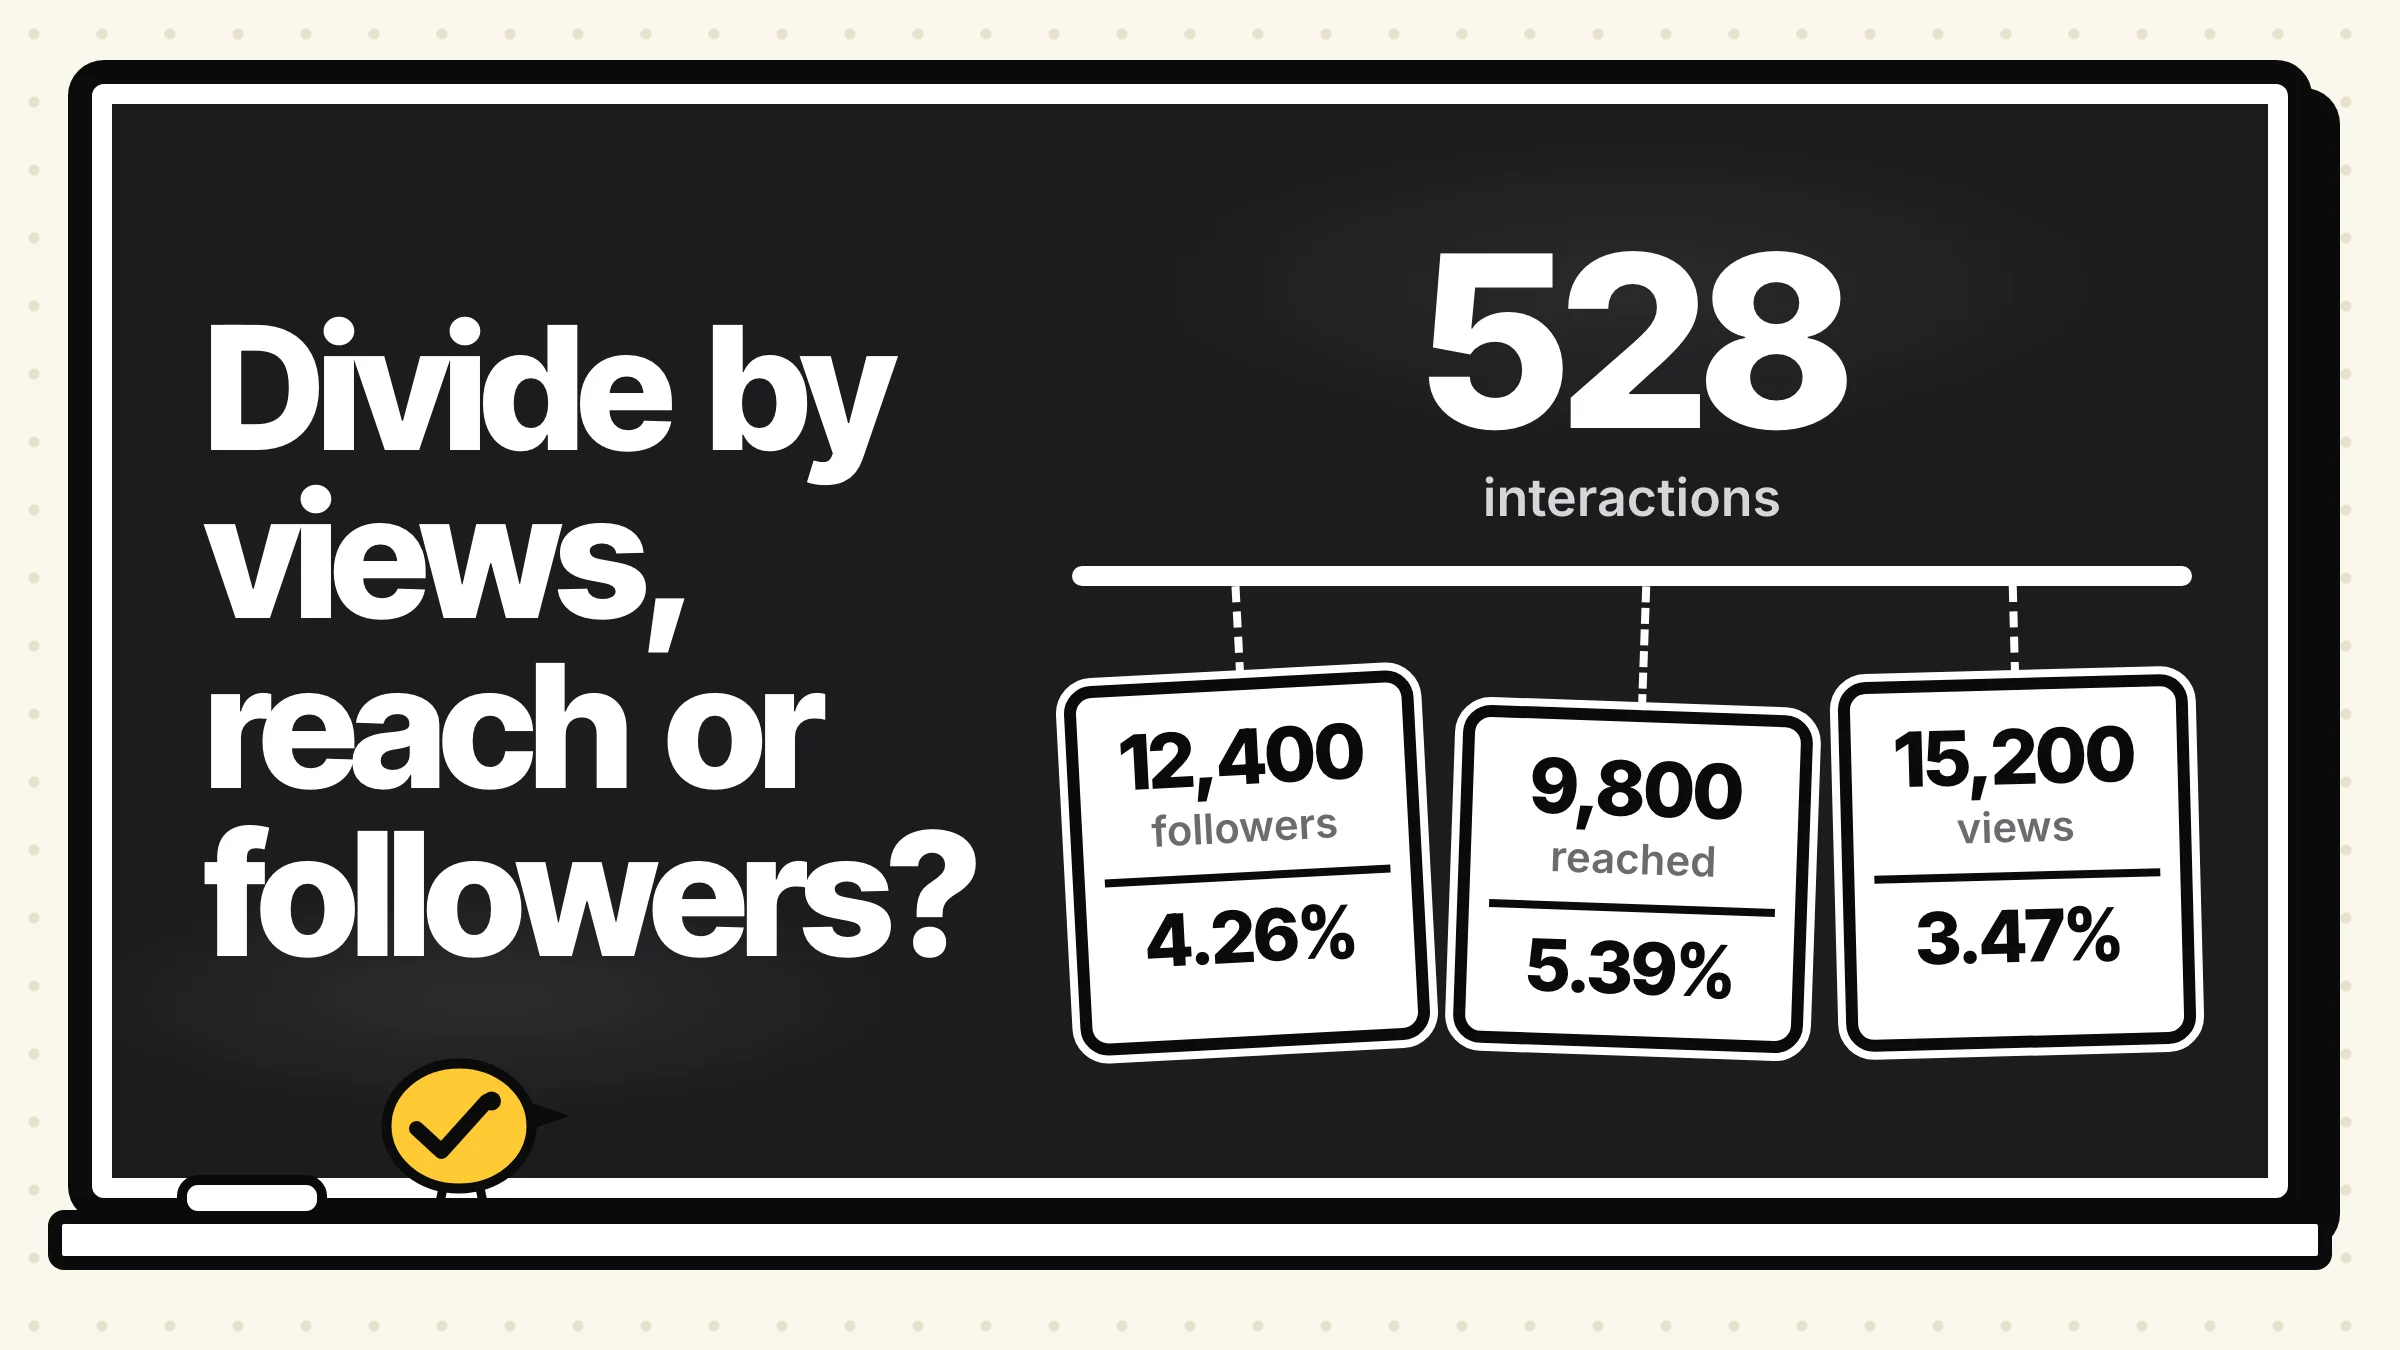
Engagement rate by views is a post's interactions divided by its views: (likes + comments + shares + saves) ÷ views × 100. It answers "how did this post do with the people who saw it?" Engagement rate by followers divides the same interactions by your follower count instead, which answers "how much does my audience act?" They give very different numbers for the same post, and the benchmarks you read online use different ones, which is why so many "good engagement rate" answers disagree.
Here is one Instagram Reel, the example in our engagement rate calculator: 412 likes, 38 comments, 21 shares and 57 saves, so 528 interactions.
| Divided by | Number | Engagement rate | What it tells you |
|---|---|---|---|
| Followers | 12,400 | 4.26% | How much your audience acts, comparable across accounts |
| Accounts reached | 9,800 | 5.39% | How the people who saw it reacted |
| Views | 15,200 | 3.47% | How the post did per time it was played |
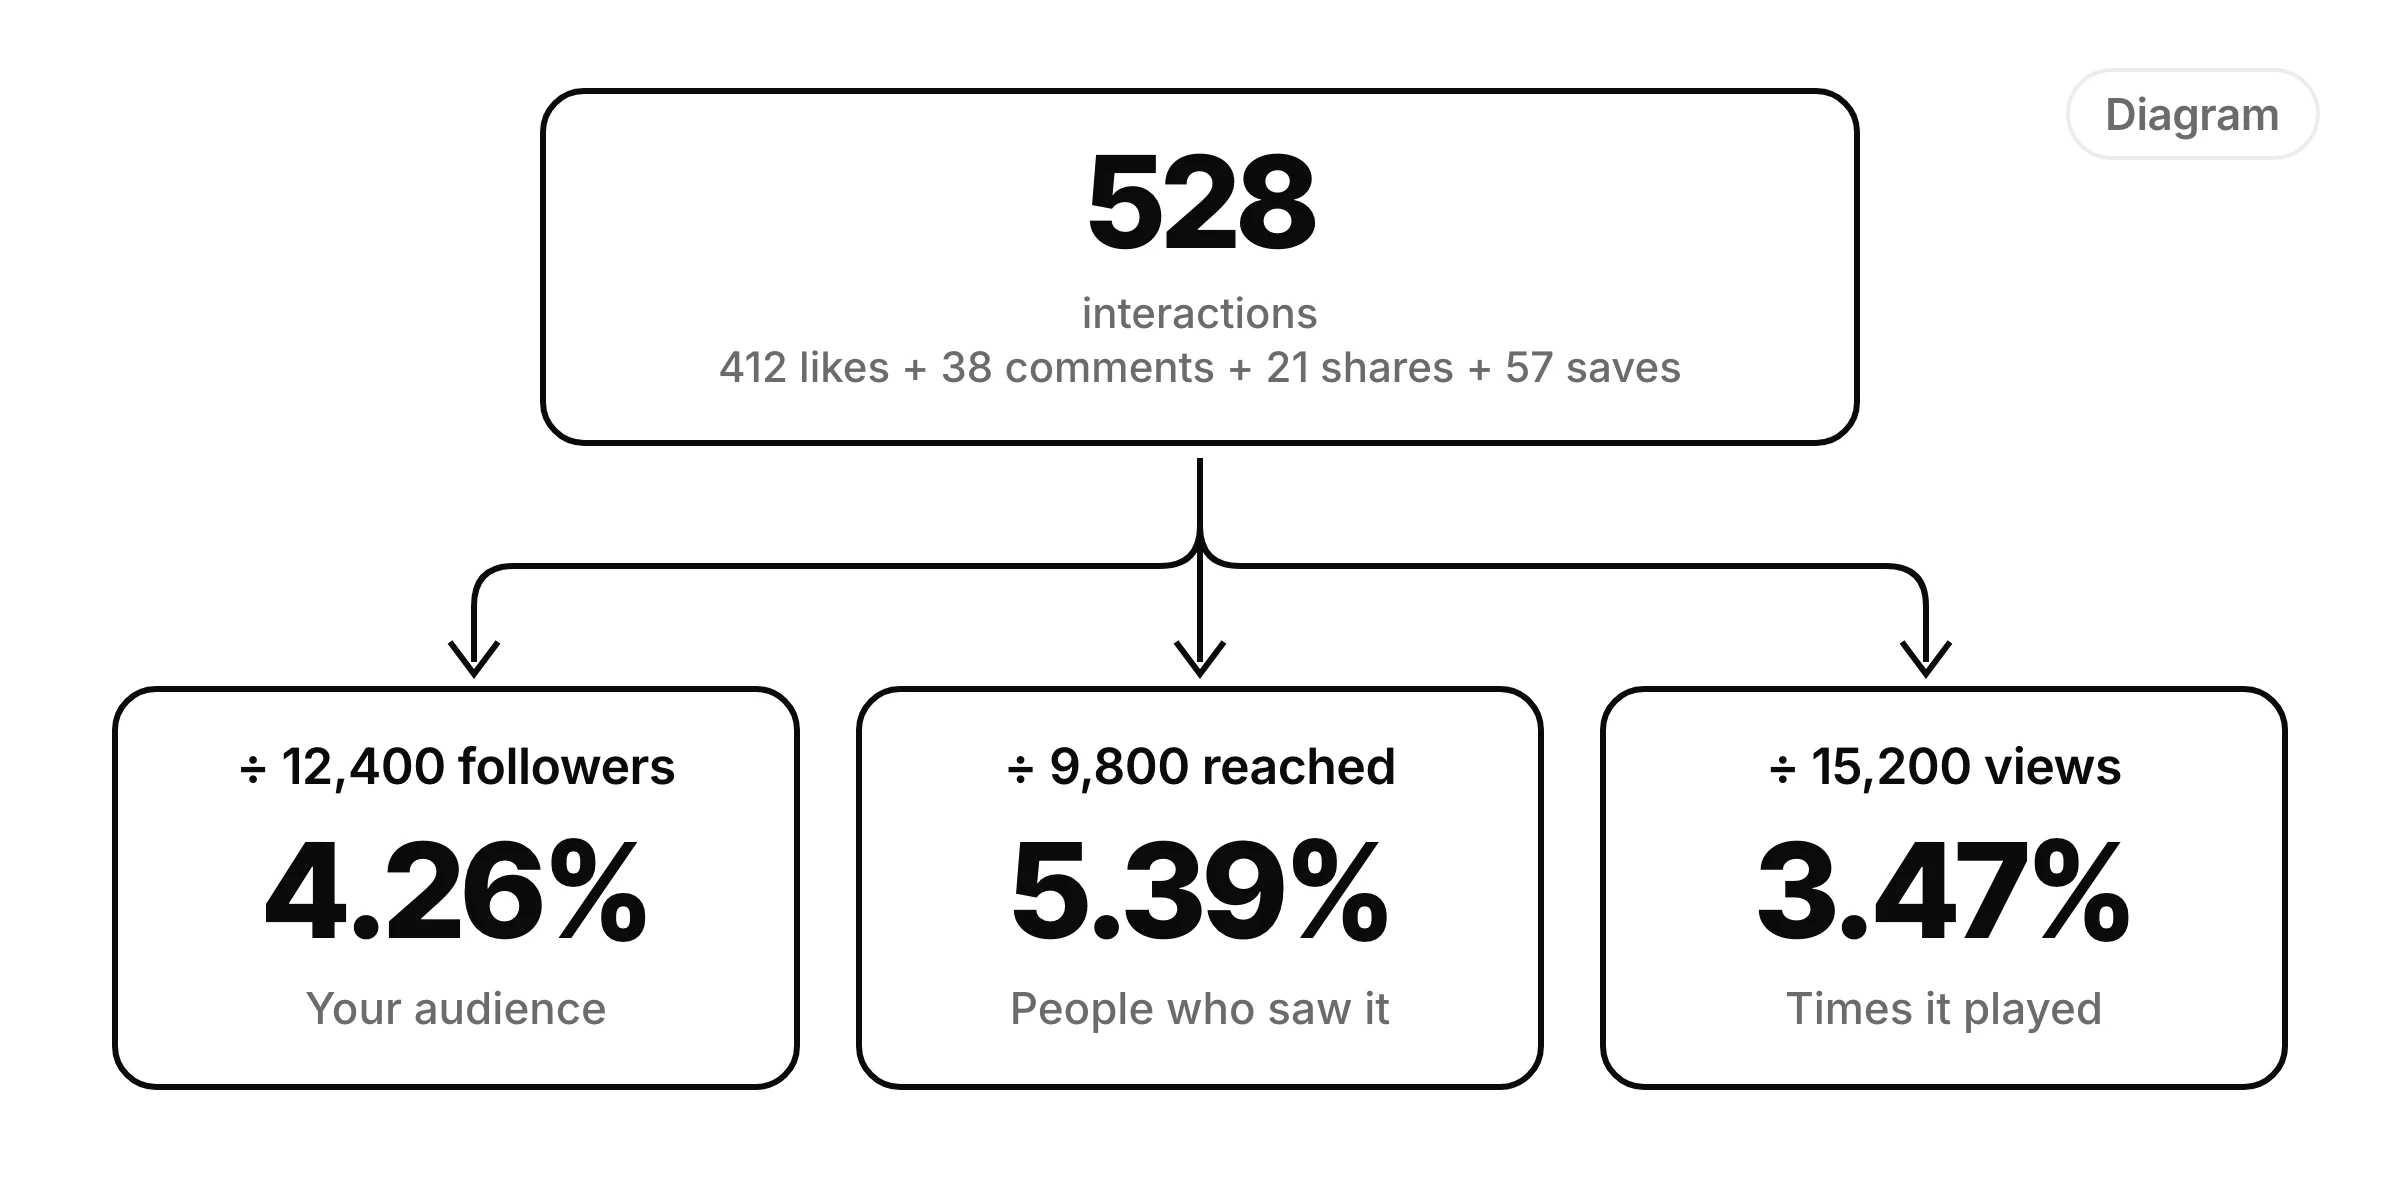
Same post, three answers. None of them is wrong.
Why views give a lower rate than reach
Views count plays, not people. Instagram's API defines views as the "total number of times IG Media has been played", while reach is the "number of unique Instagram users" who saw it (Meta's insights reference). Someone who watches your Reel three times is one account reached and three views. So for video, by views is usually lower than by reach, and a Reel that people rewatch can look worse by views than it is. Buffer's 2026 report sees a related effect in its data: Reels "are optimized for views and reach, which dilutes their per-impression engagement rate".
Views still make the fairest base for TikTok, Reels and Shorts, because many of the people who see them don't follow you. By followers, a TikTok that spreads can pass 100%.
Each platform counts it differently
Only a few platforms publish an engagement rate of their own, and they don't agree on what counts:
- LinkedIn divides clicks, reactions, comments and shares by impressions (LinkedIn Help). Clicks are in, so LinkedIn's number runs higher than one without them.
- X divides all engagements, clicks and follows included, by impressions (X's help).
- TikTok One divides likes, comments and shares by video views (TikTok's help). Saves are left out.
- Instagram, Facebook and YouTube show the interactions but no rate.
So before you compare two numbers, check both the base and what counts as an interaction.
What counts as a good engagement rate
Compare your rate only with a benchmark that uses the same base. The two big 2026 reports don't:
| Platform | By followers (Rival IQ 2026, all-industry median) | By reach (Buffer 2026, median) |
|---|---|---|
| 0.30% | about 5.5% | |
| TikTok | 2.01% | about 4.6% |
| X | 0.03% | about 2.5% |
| YouTube | 0.21% | not given |
| not given | about 6.2% | |
| not given | about 5.6% | |
| Threads | not covered | about 3.6% |
On Instagram that's 0.30% against 5.5%, an 18-fold gap, and much of it is the base. Rival IQ divides interactions by follower count, for 150 companies in each of its industries. Buffer divides by reach, or "the closest equivalent (like impressions or views)" where there's no reach, over 52 million posts from accounts that use Buffer. Neither gives a views-only benchmark, so read a by-views rate against Buffer's column, knowing a rate by views usually comes out lower than by reach.
A rough guide, then: by followers, beating the median for your platform is good. By reach or views, a few percent is typical, and above Buffer's median is good. Two more rules matter more than either table:
- Wait for enough views. One save on a post with 5 views is a 20% engagement rate, and it means nothing. Read a rate once a post has at least a hundred views and a few interactions.
- Beat your own usual post. Your account's size, niche and audience all move the number, and no benchmark knows them. A post that beats your median on the same platform did well, whatever the tables say.
How Yaybird measures it
When I built Results in Yaybird, I wanted one rate that means the same on every platform. So it divides likes, comments, shares and saves by views, or by impressions where a platform has no views. Clicks are left out, so when people clicked, a LinkedIn rate in Yaybird reads lower than the one in LinkedIn's own analytics. It keeps the rate each platform reports too, but never compares those across platforms. A post or a platform with fewer than 100 views or 3 interactions is still shown but never called the best. And "What worked" compares each post with your usual post on the same platform, so a big platform doesn't make its formats look better.
Want to try your own numbers first? The free engagement rate calculator shows each rate side by side for Instagram, TikTok, LinkedIn, X, Facebook and YouTube.
Questions
Can engagement rate be over 100%?
By followers, yes. A TikTok video seen by far more people than follow you can get more interactions than you have followers. By views it almost never does, because each interaction comes from someone who saw the post.
Does Instagram show an engagement rate?
No. Its insights show likes, comments, shares, saves, views and accounts reached, but no rate. You work it out yourself, or paste the numbers into a calculator.
Which engagement rate should I use for TikTok?
By views. Many people who see a TikTok don't follow you, so follower counts say little about one video. TikTok One's campaign reporting divides likes, comments and shares by video views.
Drafted with AI from our research, fact-checked against the platforms' docs and our code, and reviewed by Hamza.

About the author
I build Yaybird, where your AI writes the posts and you approve them on your phone.